GIS & Water Measurements Modules
The GIS section displays spatial mapping and historical measurements across five sub-categories: River Flow Levels, Dam Levels, Water Quality, Rainfall, and Groundwater.
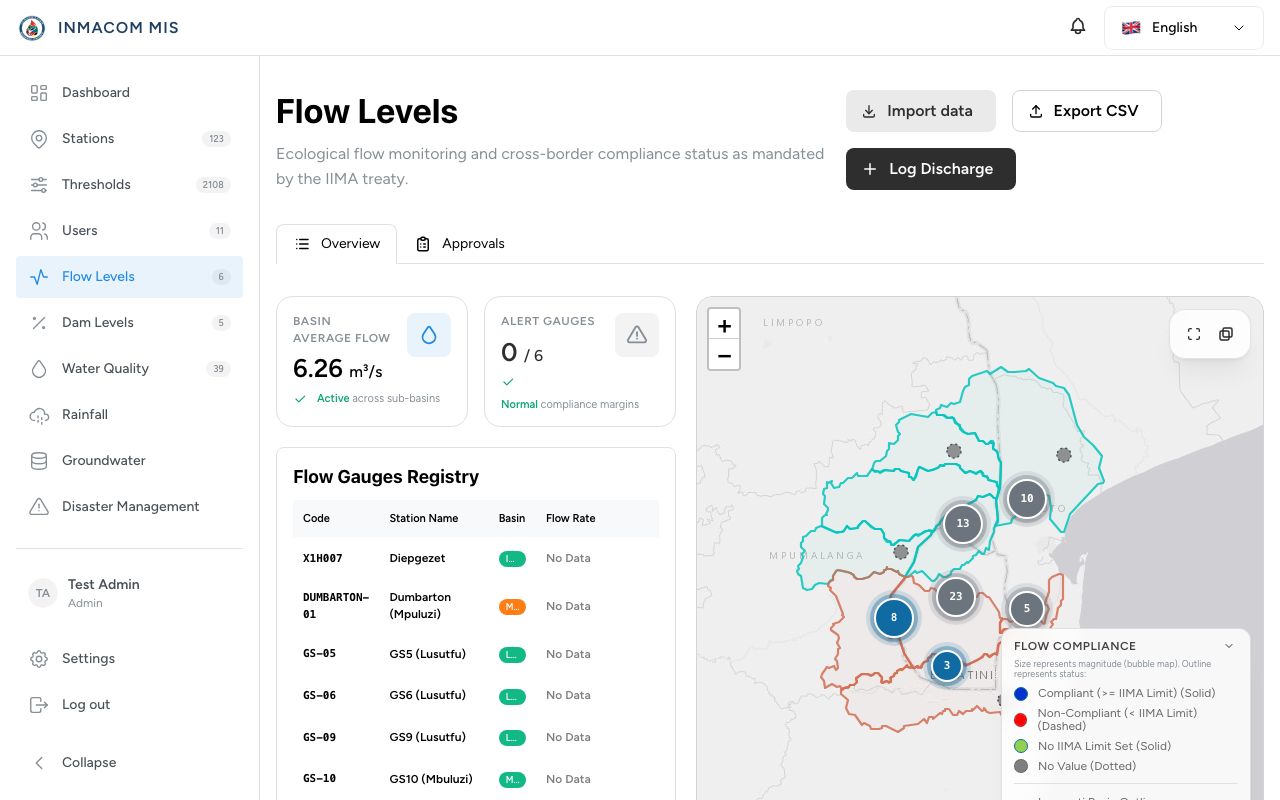
The Five GIS Categories
Each GIS module represents a specific dataset and expects the following values:
| Category | Database Category | Primary Unit | Key Parameter / Field |
|---|---|---|---|
| Flow Levels | river | m³/s | Flow volume passing a specific gauge. |
| Dam Levels | dam | % or million m³ | Full supply capacity (FSC %) and volume. |
| Water Quality | wq | Variable (e.g. mg/L) | Parameters: pH, Dissolved Oxygen, Conductivity, Temp. |
| Rainfall | rain | mm | Cumulative precipitation. |
| Groundwater | ground | m (below surface) | Water table level and depth. |
Data Array Contracts
All GIS index routes in GisController.php query and pass three distinct arrays to the Inertia page view:
- Live Rows: Authenticated/approved measurements that represent the current state of active stations.
- Pending Rows: Submitted measurements awaiting manager/admin review.
- Historical Rows: A timeline of approved past measurements used by charts to render trends.
{
  "live": [
    { "id": "uuid-1", "station_code": "E12", "value": 15.4, "unit": "m3/s", "date": "2026-06-10T12:00:00Z" }
  ],
  "pending": [
    { "id": "uuid-2", "station_code": "E12", "value": 14.8, "unit": "m3/s", "status": "pending" }
  ],
  "history": [
    { "date": "2026-06-09", "value": 15.0 },
    { "date": "2026-06-08", "value": 16.2 }
  ]
}
2-Step Measurement Approvals
To ensure data integrity, measurements uploaded to the system must go through the review workflow.
       ┌────────────────────────┐
       │ Clerk uploads/creates  │
       │  pending Measurement   │
       └───────────┬────────────┘
                   ▼
       ┌────────────────────────┐
       │ Status: 'pending'      │
       └───────────┬────────────┘
                   ▼
       ┌────────────────────────┐
       │ Manager/Admin reviews  │
       └─────┬───────────┬──────┘
             │           │
    Approve  │           │  Reject
             ▼           ▼
  ┌─────────────────┐  ┌─────────────────┐
  │ Status:         │  │ Status:         │
  │ 'approved'      │  │ 'rejected'      │
  │                 │  │                 │
  │ (Data becomes   │  │ (Data stays     │
  │  active/live)   │  │  hidden; logs   │
  │                 │  │  reason comment)│
  └─────────────────┘  └─────────────────┘
Endpoints
- Create Pending:
POST /measurements-> creates a record with statuspending. - Update Pending:
PATCH /measurements/{id}-> edits the pending record. - Approve:
POST /measurements/{id}/approve-> changes status toapproved. - Reject:
POST /measurements/{id}/reject-> changes status torejectedand appends review notes.
Map & Charting Integration
1. The Interactive GIS Map (GisMap.tsx)
The shared map renders all stations within the Incomati Basin:
- Renders green markers for operational/approved stations, orange for pending, and red for offline/alert states.
- Uses Leaflet’s bounds configuration to focus specifically on the Mozambique-South Africa-Eswatini borders.
2. Historical Recharts (HistoricalCharts.tsx)
This component displays historical trends for selected stations:
- Calculates moving averages.
- Highlights threshold lines (e.g. drawing a dashed red line at the minimum Eflow requirements or water quality safety thresholds).
- Supports toggling between custom time windows (7 Days, 30 Days, 1 Year).